
Atherosclerotic plaque fibrous cap assessment under an oblique scan plane orientation in carotid MRI
Introduction
Carotid magnetic resonance imaging (MRI) is used to noninvasively image atherosclerotic plaques at the carotid bifurcation (1,2). Of particular relevance are rupture-prone, vulnerable plaques, which are morphologically constituted of a large lipid-rich necrotic core (LRNC) covered by a thin fibrous cap (FC) (3,4). Carotid plaque rupture is a major cause of transient ischemic attacks and ischemic strokes. The principal advantage of carotid MRI is its high soft-tissue contrast, which allows visualization of individual plaque components (5,6). Black-blood, contrast-enhanced MRI sequences assist in FC visualization by enhancing the FC signal relative to the adjacent LRNC (7-9). However, quantitative thickness measurements of FCs are prone to error due to the limited in-plane voxel size with respect to FC thickness (10-12). Instead, a more straightforward and more reliable qualitative assessment of FC status (e.g., thick, thin, and ruptured) in vivo through carotid MRI has been proven to be clinically highly relevant (13-19).
Most clinical protocols today employ 2D multi-slice sequences and acquire anisotropic voxels (20). With anisotropic voxels, one can reach a smaller in-plane voxel size while maintaining the same voxel volume and signal-to-noise ratio (SNR) because of a relatively larger slice thickness (21). Recent advances in 3D carotid MRI pulse sequence design enable isotropic-voxel plaque imaging (22). Irrespective of the acquisition methodology (i.e., 2D or 3D), the choice of a relatively smaller in-plane voxel size will facilitate visualization of in-plane plaque features—such as thin FCs—by reducing in-plane partial volume effects and point-spread function (PSF) signal spreading (10,11). On the downside, axial partial volume effects in anisotropic voxels can not only be caused by plaque morphological variations in the slice-select direction within a slice (23,24), but also by an oblique scan plane orientation in relation to the localized FC orientation (25). In clinical practice, the slice-select direction is typically aligned with the common carotid axis proximal to the bifurcation, using a localizer on an MR angiography scout scan in a sagittal view (Figure 1). A plaque could therefore be imaged at an angle, which, on top of the already limited in-plane resolution, might decrease FC contrast, thus preventing a reliable status assessment. A FC is often the smallest feature of a plaque, making it the most susceptible to obliquity artifacts. In addition, a plaque is usually present at locations with large geometrical variations or vessel angulations (26,27). An oblique scan plane orientation affects carotid wall area measurements and could influence FC imaging (28). Whether or not imaging at a certain angle would obscure a FC and prevent its differentiation from the adjacent LRNC depends on numerous factors, such as the scan protocol, tissue relaxation times, FC thickness, in-plane resolution, slice thickness, and SNR. In this study, we took into account all of these factors for a typical 2D contrast-enhanced T1-weighted pulse sequence and quantified the influence of scan plane obliquity and voxel dimensions on FC contrast.

Methods
We performed numerical MRI simulations of a typical 2D carotid MRI protocol on idealized plaque models and varied the cap thickness (d), the acquired in-plane voxel size, the slice thickness (δ), and the scan plane orientation angle (θ). The advantage of MRI simulations is that they allow a perfectly controlled environment where single parameters can be varied, which is impracticable in a patient study. For a reliable FC status assessment, the FC contrast should be sufficiently high in relation to the adjacent LRNC contrast and the SNR. We therefore quantified the effects of the aforementioned parameters on FC contrast. Because we focused on scan plane obliquity, axial plaque morphological variations were not taken into account. Scan plane obliquity was confined to the direction of relevance: the short axis of the FC (i.e., the FC thickness direction). Each methodological step will now be discussed in more detail.
Trigonometric model
Before commencing the MRI simulations, it was important to gain a feeling for the combined effects of θ, δ, and d on the spatial distribution of FC tissue within a slice in the direction of angulation (x). We therefore created a simple analytical 1D trigonometric model (Figure 2A). To maintain generality at this point, we confined ourselves to a geometrical analysis and focused on λ(x): the fraction [%] of tissue at location x occupied by the FC. Location B is given by δtan(θ), and location C by d/cos(θ). Also note that apparent FC thickness increased with a factor 1/cos(θ). These simple geometrical relationships helped explain some observations from the MRI simulations.

Idealized plaque models
Three idealized carotid plaque models with a single LRNC and no other components were created, each with only a different FC thickness: 0.5, 1, and 1.5 mm. Although FCs of vulnerable carotid plaques can be thinner than 0.5 mm (10,29), we did not include these, because they would fall below the typical in-plane acquired voxel size of current clinical carotid MRI protocols, and would become obscured regardless of scan plane obliquity (16). The lumen diameter (4.5 mm), outer wall diameter (9.0 mm), LRNC shape, LRNC size (14 mm2), and LRNC width (2.4 mm) of the idealized models were kept unaltered and were based on typical dimensions of diseased carotid arteries. The modeled plaque tissues were fibrous tissue, LRNC, and the sternocleidomastoid muscle (used as background), and were assigned T1 relaxation times of 680, 1,220, and 1,412 ms respectively, and a fixed T2 of 50 ms for the MRI simulations (11). The models were angulated from 0° to 40° in steps of 10° with respect to the axial axis. The direction of the FC thickness was aligned with the phase direction in the MRI simulations and likewise was the direction of scan plane obliquity. This choice was made because Gibbs ringing artifacts manifesting predominantly in the frequency (measurement) direction could influence tissue intensity at the edge of the lumen (11,28).
MRI simulations
A standard clinically applied 3.0T, 2D T1-weighted turbo spin-echo, contrast-enhanced, black-blood pulse sequence used for FC imaging was implemented in the Juelich Extensible MRI Simulator (JEMRIS) (30). A detailed description of this particular implementation including an evaluation with patient images can be found in (11). The simulated pulse sequence used non-selective radio frequency pulses, which eliminated the need for slice selection and spoiler gradients, resulting in single slice simulations. The repetition and echo timings were 800 and 10 ms, respectively. The simulated sequence covered a field-of-view of 37 mm × 37 mm with a matrix size of 60 × 60 which yielded the same in-plane acquisition voxel size as the original clinical protocol: 0.62 mm × 0.62 mm. The reduced field-of-view was obtained by decreasing the number of shots while keeping both the turbo-spin echo factor (equal to 10) and k-space filling order (centric) unaltered. A reconstructed voxel size of 0.31 mm × 0.31 mm was achieved after zero-padding of the k-space prior to Fourier transforming. The slice thickness of the original clinical protocol was δ=2 mm. For this study, we additionally simulated slice thicknesses of 1 and 3 mm. A modified protocol with a smaller in-plane acquired voxel size of 0.31 mm × 0.31 mm (0.16 mm × 0.16 mm reconstructed) was also simulated. Such changes in voxel sizes would affect the SNR and/or scan time in clinical systems according to the SNR equation. Because our simulations yielded noise-free images, our FC contrast findings can be assessed post-hoc for any arbitrary SNR levels. The actual measure for resolving small features in MRI is the PSF, and its importance is the reason we performed MRI simulations instead of simply geometrical re-sampling (11). The full-width at half-maximum of the PSF in the phase direction (which was the direction of angulation) in the image space was 1.1 mm for the original 0.62 mm × 0.62 mm protocol and 0.55 mm for the modified 0.31 mm × 0.31 mm protocol. The simulations were performed with a high spin-discretization, with an average of ~8,000 simulated spins per voxel. Black-blood imaging was simulated by defining no magnetization of the luminal area. Motion artifacts were not simulated.
Analysis
For each resulting noise-free (1/SNR=0) simulated carotid MR image, the FC contrast was computed. The FC contrast was defined as the maximum FC intensity relative to the minimum intensity of the adjacent LRNC, and therefore computed with the following contrast-to-tissue equation: (Icap,max – ILRNC,min)/ILRNC,min (31). Note that the theoretical upper-limit of the FC contrast, CFC,max, can be derived from the repetition time (TR) and the apparent T1 relaxation times (tissues had identical T2 times) of LRNC and fibrous tissues:
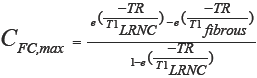
With the modeled tissue T1 relaxation times, the theoretically maximum FC contrast with no partial volume effects or PSF signal spreading was equal to 0.44. The SNR was defined as the reciprocal of the coefficient of variation. This definition enabled a direct comparison between FC contrast and 1/SNR, because if the FC contrast would be lower than 1/SNR (i.e., the relative noise level), the FC would likely be obscured. We also asked one (blinded) MRI reader (Z.K.) to measure the FC thickness on a set of images with δ=2 mm and with added noise (SNR=16.7), in the situation where the FC was not judged as obscured by that reader. The images were presented in randomized order on five separate occasions.
Results
Trigonometric model
We first studied our 1D geometrical model. In Figure 2, we graph two cases: d=δ/2 (Figure 2C) and d=δ/4 (Figure 2D) for θ=0° to 40°. We defined a critical angle, θc=sin–1(d/δ), when B=C (Figure 2B). This critical angle represents the smallest angle at which less than 100% at any location x is occupied by FC tissue. For d=δ/2, θc=30°, and for d=δ/4, θc=14.5°. So, interestingly, in the limit of a hypothetical in-plane voxel size << d, no obscurément of the FC should occur for θ<30° in the case of d=δ/2. However, for d=δ/4, the critical angle dropped to only 14.5°. Because this is just a geometrical analysis, the critical angle—a simple indicative but rather strict measure—does not directly translate to MR imaging, where the in-plane voxel size (typically ~d), PSF, and SNR play significant roles as well.
MRI simulations
Simulated MR images for the case of δ=2 mm are shown in Figure 3. The scan plane obliquity angle θ was found to have a strong effect on the appearance of FCs in certain configurations of the parameters studied. A cap of 0.5 mm thickness was already indistinguishable at θ=0° for an in-plane acquired voxel size of 0.62 mm × 0.62 mm, while a cap of 1.0 mm (hardly visible at θ=0°) became obscured at 40°. For an acquired in-plane voxel size of 0.31 mm × 0.31 mm, a cap of 0.5 mm, clearly visible at θ=0°, was obscured at θ=40°. A FC of 1.5 mm thickness remained visible up to θ=40°. In general, thicker FCs appeared to be largely insensitive to scan plane obliquity, especially when imaged at the higher in-plane resolution. Increasing θ led to a reduction in FC contrast. FC contrast was clearly higher for thicker caps and for the 0.31 mm × 0.31 mm protocol, due to reduced in-plane partial volume effects.

The results of the manual FC thickness measurements (for the case with δ=2 mm and SNR =16.7) are shown in Figure 4. In general, the overestimation of FC thickness increased for increasing θ. For example, the thickness of a 1.5 mm FC was measured as 1.55±0.14 mm for θ=0°, and as 2.08±0.29 mm for θ=40° with the original 0.62 mm × 0.62 mm protocol. For the modified 0.31 mm × 0.31 mm protocol, the thickness of a FC of 1.5 mm was measured as 1.67±0.09 mm for θ=0°, and as 1.87±0.08 mm for θ=40°.

The FC contrast as a function of θ for all plaque models and scan parameters with 1/SNR=0 is shown in Figure 5. FC contrast became less dependent on θ for larger d, smaller δ, or a larger in-plane voxel size (thus approaching isotropic voxels). In fact, FC contrast even slightly increased for increasing θ in the δ=1 mm case. In general, a thicker FC, or the use of a high in-plane resolution (anisotropic) protocol, led to significantly increased FC contrast. These two factors, in many cases, outweighed the influence of scan plane obliquity on FC contrast. Figure 5 provides quantitative data on how the FC contrast depends on the studied scan parameters. With the SNR and imaging parameters known, it is now possible to determine which FCs would become indistinguishable. For example, consider the case where SNR=16.7 and δ=2 mm. When imaged with an acquired voxel size of 0.62 mm × 0.62 mm × 2.00 mm at θ=40°, the contrasts of FCs of 0.5 and 1.0 mm thickness were in the order of 1/SNR (or lower), shown as the dotted line in Figure 5B. This was also true for a FC of 0.5 mm imaged with an acquired voxel size of 0.31 mm × 0.31 mm × 2.00 mm at θ=40°. These FCs would likely be obscured, preventing a reliable qualitative assessment of their status. At θ=0°, only the contrast of a FC of 0.5 mm thickness imaged with an acquired voxel size of 0.62 mm × 0.62 mm × 2.00 mm fell below 1/SNR. And indeed, these findings corresponded with what we previously determined from Figure 3, and were largely in line with the MRI reader decisions.

Discussion
We investigated the influence of an oblique scan plane orientation in combination with voxel dimensions on FC contrast (i.e., FC intensity relative to the adjacent LRNC) for a typical 2D clinical T1-weighted, black-blood, contrast-enhanced carotid MRI protocol. The use of MRI simulations allowed full scan parameter control and precise knowledge of the plaque geometry, FC thickness, and tissue relaxation times.
Using higher voxel anisotropy or imaging thinner FCs led to a larger influence of scan plane obliquity on FC contrast. The latter is of particular concern because the thinner the FC gets, the more vulnerable the plaque becomes (32). Nevertheless, our simulations showed that the in-plane voxel size and the FC thickness strongly determine FC contrast, and, most interestingly, often outweigh scan plane obliquity for angles up to 40°. FC signal intensity strongly increases if the FC is covered by more voxels when considering out-of-voxel PSF signal spreading. Our findings for different in-plane acquired voxel sizes at no scan plane obliquity (θ=0°) are thus already interesting in and of themselves. We found that, on average, the measured FC thickness increased for increasing θ, as expected from the increase in apparent thickness. An oblique scan plane orientation (or a larger in-plane voxel size) decreases intensity gradients at plaque component interfaces (blurred edges), which affects segmentation accuracy (33). An elaborate analysis of the overestimation of mm-scale thickness features under scan plane orientation obliquity is given in (28). All FCs with a contrast <1/SNR were judged by the MRI reader as obscured while all FCs with a contrast >2/SNR were judged as visible. Out-of-voxel PSF signal spreading caused FC contrast to slightly increase with θ in the cases where d≥δ. When imaging any FC at an angle with a finite slice thickness δ, the total amount of FC tissue present in the slice (the integral of λ(x)) increases. If the FC intensity profile would be modeled as the convolution of the PSF(x) and λ(x), one would indeed find a slight increase in peak FC intensity with respect to θ=0° for the combinations of parameters for which an increase in FC contrast was observed in the MRI simulations. When approaching near isotropic voxels in clinical systems, PSF signal spreading in the slice-select direction or slice overlapping would attenuate this FC intensity enhancement. For clinically applied MRI, alterations in the field-of-view and/or voxel dimensions impact the total scan time and/or SNR (not FC contrast, being a relative measure) according to the SNR equation. An advantage of our methodology was that the simulated images were free of noise, which allows the assessment of FC contrast data reported in our study for arbitrary SNR levels.
Isotropic resolution carotid MR imaging—which is increasingly being used—renders the issue of scan plane obliquity obsolete and it is currently claimed to be favorable for imaging small features (22,23). However, our simulations suggest otherwise: isotropic imaging can actually lead to reduced FC contrast when the FC thickness is less than the PSF width, which is usually the case. Because FC thickness is a predominantly in-plane feature, anisotropic voxels can provide higher FC contrast. While we found that an oblique scan plane orientation reduces FC contrast, we observed that increasing the in-plane resolution (while decreasing the slice thickness) still yielded considerably higher FC contrast even at moderate (<40°) scan plane obliquity. This supports the use of anisotropic voxels for FC imaging. In 3D sequences, the number of slice-select phase encoding steps can be lowered to achieve anisotropic imaging, which could also extend to a reduction in scan time and/or noise. We also demonstrated that a properly aligned scan direction at the slice containing the plaque can significantly increase FC contrast, which calls for further investigation into the improvement of scan planning in carotid MRI for FC status assessment in clinical practice, and into the possibility of a priori estimation of FC orientation. Interestingly, our simulations showed that the combination of merely geometrical angulations and finite voxel imaging can obscure even relatively thick FCs (>0.5 mm) in carotid MRI. This obscurément could lead to a false evaluation of FC absence (or thinning) in potentially stable lesions.
A number of assumptions and simplifications were made. Motion artifacts (34) or influences from imperfect blood signal suppression (35), which could contribute to obscuring the FC in addition to scan plane obliquity, were not modeled. Furthermore, a uniform B1 homogeneity was assumed with fixed repetition and echo times in the protocol, and T1 relaxation times for FC and LRNC tissue were not varied. Note that while these parameters influenced FC contrast equation, they did not affect the relationship with scan plane angle. In the simulations, perfect (uniform) slice excitation was assumed with no influence from other slices (i.e., no cross-talk in case of 2D protocols, or no axial PSF or Gibbs ringing effects in case of 3D protocols). Such effects were not simulated because they are highly protocol-specific. We did not model axial FC morphological variations within a slice. These variations can be substantial, as reported in previous studies (22-24), and should be subject of further investigation. Plaque tissues were modeled as homogeneous, given the large differences in biological structure between FCs and LRNCs (3). A FC is typically well defined in contrast-enhanced MRI as the consequence of different relaxation times of fibrous tissue with gadolinium-uptake and the underlying LRNC (8,9). However, the FC-LRNC interface is not always sharp-edged as assumed in our study. Because the FC thickness measurements were performed on idealized models, those results cannot be directly translated to actual in vivo MRI. The advantage of MRI simulations was that we could investigate solely scan plane obliquity without obstructions from any of the aforementioned effects; however, these matters could also influence FC status assessment in practice.
Conclusions
While isotropic-voxel carotid MRI eliminates the issue of scan plane obliqueness, the relatively larger in-plane voxel size could cause FC contrast reduction. In our simulations, a smaller in-plane voxel size at the cost of a larger slice thickness (i.e., voxel anisotropy) often enhanced FC contrast even in the presence of scan plane orientation angles up to 40°. If scan plane orientation obliquity at the slice of interest is moderate (<40°) or otherwise diminished through careful scan planning, the acquisition of anisotropic voxels could significantly enhance FC contrast which, in effect, could improve the reliability of FC status assessment.
Acknowledgements
We would like to thank Tom Geraedts (Philips Healthcare, Best, the Netherlands) for useful discussions. This research was performed within the framework of CTMM, the Center for Translational Molecular Medicine (www.ctmm.nl), project PARISk (grant 01C-202), and supported by the Dutch Heart Foundation.
Disclosure: The authors declare no conflict of interest.
References
- Toussaint JF, LaMuraglia GM, Southern JF, Fuster V, Kantor HL. Magnetic resonance images lipid, fibrous, calcified, hemorrhagic, and thrombotic components of human atherosclerosis in vivo. Circulation 1996;94:932-8. [PubMed]
- Cai JM, Hatsukami TS, Ferguson MS, Small R, Polissar NL, Yuan C. Classification of human carotid atherosclerotic lesions with in vivo multicontrast magnetic resonance imaging. Circulation 2002;106:1368-73. [PubMed]
- Virmani R, Burke AP, Farb A, Kolodgie FD. Pathology of the vulnerable plaque. J Am Coll Cardiol 2006;47:C13-8. [PubMed]
- Li ZY, Howarth SP, Tang T, Gillard JH. How critical is fibrous cap thickness to carotid plaque stability? A flow-plaque interaction model. Stroke 2006;37:1195-9. [PubMed]
- Saam T, Ferguson MS, Yarnykh VL, Takaya N, Xu D, Polissar NL, Hatsukami TS, Yuan C. Quantitative evaluation of carotid plaque composition by in vivo MRI. Arterioscler Thromb Vasc Biol 2005;25:234-9. [PubMed]
- Underhill HR, Hatsukami TS, Fayad ZA, Fuster V, Yuan C. MRI of carotid atherosclerosis: clinical implications and future directions. Nat Rev Cardiol 2010;7:165-73. [PubMed]
- Yuan C, Kerwin WS, Ferguson MS, Polissar N, Zhang S, Cai J, Hatsukami TS. Contrast-enhanced high resolution MRI for atherosclerotic carotid artery tissue characterization. J Magn Reson Imaging 2002;15:62-7. [PubMed]
- Wasserman BA, Smith WI, Trout HH 3rd, Cannon RO 3rd, Balaban RS, Arai AE. Carotid artery atherosclerosis: in vivo morphologic characterization with gadolinium-enhanced double-oblique MR imaging initial results. Radiology 2002;223:566-73. [PubMed]
- Cai J, Hatsukami TS, Ferguson MS, Kerwin WS, Saam T, Chu B, Takaya N, Polissar NL, Yuan C. In vivo quantitative measurement of intact fibrous cap and lipid-rich necrotic core size in atherosclerotic carotid plaque: comparison of high-resolution, contrast-enhanced magnetic resonance imaging and histology. Circulation 2005;112:3437-44. [PubMed]
- Redgrave JN, Gallagher P, Lovett JK, Rothwell PM. Critical cap thickness and rupture in symptomatic carotid plaques: the oxford plaque study. Stroke 2008;39:1722-9. [PubMed]
- Nieuwstadt HA, Geraedts TR, Truijman MT, Kooi ME, van der Lugt A, van der Steen AF, Wentzel JJ, Breeuwer M, Gijsen FJ. Numerical simulations of carotid MRI quantify the accuracy in measuring atherosclerotic plaque components in vivo. Magn Reson Med 2014;72:188-201. [PubMed]
- Schär M, Kim WY, Stuber M, Boesiger P, Manning WJ, Botnar RM. The impact of spatial resolution and respiratory motion on MR imaging of atherosclerotic plaque. J Magn Reson Imaging 2003;17:538-44. [PubMed]
- Hatsukami TS, Ross R, Polissar NL, Yuan C. Visualization of fibrous cap thickness and rupture in human atherosclerotic carotid plaque in vivo with high-resolution magnetic resonance imaging. Circulation 2000;102:959-64. [PubMed]
- Takaya N, Yuan C, Chu B, Saam T, Underhill H, Cai J, Tran N, Polissar NL, Isaac C, Ferguson MS, Garden GA, Cramer SC, Maravilla KR, Hashimoto B, Hatsukami TS. Association between carotid plaque characteristics and subsequent ischemic cerebrovascular events: a prospective assessment with MRI--initial results. Stroke 2006;37:818-23. [PubMed]
- Yuan C, Zhang SX, Polissar NL, Echelard D, Ortiz G, Davis JW, Ellington E, Ferguson MS, Hatsukami TS. Identification of fibrous cap rupture with magnetic resonance imaging is highly associated with recent transient ischemic attack or stroke. Circulation 2002;105:181-5. [PubMed]
- Kwee RM, van Engelshoven JM, Mess WH, ter Berg JW, Schreuder FH, Franke CL, Korten AG, Meems BJ, van Oostenbrugge RJ, Wildberger JE, Kooi ME. Reproducibility of fibrous cap status assessment of carotid artery plaques by contrast-enhanced MRI. Stroke 2009;40:3017-21. [PubMed]
- Kwee RM, van Oostenbrugge RJ, Mess WH, Prins MH, van der Geest RJ, ter Berg JW, Franke CL, Korten AG, Meems BJ, van Engelshoven JM, Wildberger JE, Kooi ME. MRI of carotid atherosclerosis to identify TIA and stroke patients who are at risk of a recurrence. J Magn Reson Imaging 2013;37:1189-94. [PubMed]
- Saba L, Potters F, van der Lugt A, Mallarini G. Imaging of the fibrous cap in atherosclerotic carotid plaque. Cardiovasc Intervent Radiol 2010;33:681-9. [PubMed]
- Ota H, Yu W, Underhill HR, Oikawa M, Dong L, Zhao X, Polissar NL, Neradilek B, Gao T, Zhang Z, Yan Z, Guo M, Zhang Z, Hatsukami TS, Yuan C. Hemorrhage and large lipid-rich necrotic cores are independently associated with thin or ruptured fibrous caps: an in vivo 3T MRI study. Arterioscler Thromb Vasc Biol 2009;29:1696-701. [PubMed]
- Wang J, Balu N, Canton G, Yuan C. Imaging biomarkers of cardiovascular disease. J Magn Reson Imaging 2010;32:502-15. [PubMed]
- Luk-Pat GT, Gold GE, Olcott EW, Hu BS, Nishimura DG. High-resolution three-dimensional in vivo imaging of atherosclerotic plaque. Magn Reson Med 1999;42:762-71. [PubMed]
- Balu N, Yarnykh VL, Chu B, Wang J, Hatsukami T, Yuan C. Carotid plaque assessment using fast 3D isotropic resolution black-blood MRI. Magn Reson Med 2011;65:627-37. [PubMed]
- Balu N, Chu B, Hatsukami TS, Yuan C, Yarnykh VL. Comparison between 2D and 3D high-resolution black-blood techniques for carotid artery wall imaging in clinically significant atherosclerosis. J Magn Reson Imaging 2008;27:918-24. [PubMed]
- Coombs BD, Rapp JH, Ursell PC, Reilly LM, Saloner D. Structure of plaque at carotid bifurcation: high-resolution MRI with histological correlation. Stroke 2001;32:2516-21. [PubMed]
- Balu N, Kerwin WS, Chu B, Liu F, Yuan C. Serial MRI of carotid plaque burden: influence of subject repositioning on measurement precision. Magn Reson Med 2007;57:592-9. [PubMed]
- Lee SW, Antiga L, Spence JD, Steinman DA. Geometry of the carotid bifurcation predicts its exposure to disturbed flow. Stroke 2008;39:2341-7. [PubMed]
- Slager CJ, Wentzel JJ, Gijsen FJ, Schuurbiers JC, van der Wal AC, van der Steen AF, Serruys PW. The role of shear stress in the generation of rupture-prone vulnerable plaques. Nat Clin Pract Cardiovasc Med 2005;2:401-7. [PubMed]
- Antiga L, Wasserman BA, Steinman DA. On the overestimation of early wall thickening at the carotid bulb by black blood MRI, with implications for coronary and vulnerable plaque imaging. Magn Reson Med 2008;60:1020-8. [PubMed]
- Qian D, Bottomley PA. High-resolution intravascular magnetic resonance quantification of atherosclerotic plaque at 3T. J Cardiovasc Magn Reson 2012;14:20. [PubMed]
- Stöcker T, Vahedipour K, Pflugfelder D, Shah NJ. High-performance computing MRI simulations. Magn Reson Med 2010;64:186-93. [PubMed]
- Li B, Dong L, Chen B, Ji S, Cai W, Wang Y, Zhang J, Zhang Z, Wang X, Fang J. Turbo fast three-dimensional carotid artery black-blood MRI by combining three-dimensional MERGE sequence with compressed sensing. Magn Reson Med 2013;70:1347-52. [PubMed]
- Loree HM, Kamm RD, Stringfellow RG, Lee RT. Effects of fibrous cap thickness on peak circumferential stress in model atherosclerotic vessels. Circ Res 1992;71:850-8. [PubMed]
- Greenman RL, Wang X, Ngo L, Marquis RP, Farrar N. An assessment of the sharpness of carotid artery tissue boundaries with acquisition voxel size and field strength. Magn Reson Imaging 2008;26:246-53. [PubMed]
- Boussel L, Herigault G, de la Vega A, Nonent M, Douek PC, Serfaty JM. Swallowing, arterial pulsation, and breathing induce motion artifacts in carotid artery MRI. J Magn Reson Imaging 2006;23:413-5. [PubMed]
- Dong L, Wang J, Yarnykh VL, Underhill HR, Neradilek MB, Polissar N, Hatsukami TS, Yuan C. Efficient flow suppressed MRI improves interscan reproducibility of carotid atherosclerosis plaque burden measurements. J Magn Reson Imaging 2010;32:452-8. [PubMed]

