
The effect of changes to MOLLI scheme on T1 mapping and extra cellular volume calculation in healthy volunteers with 3 tesla cardiovascular magnetic resonance imaging
Introduction
The value of detection of focal myocardial scar that characterises a number of disease processes using late gadolinium enhancement (LGE) imaging is well recognised (1,2). However, this technique relies upon contrast between healthy and diseased myocardium and as a result it is limited in the detection of diffuse myocardial disease processes characterised by diffuse fibrosis or infiltration.
Longitudinal relaxation time (T1) mapping allows quantitative myocardial tissue characterisation; thereby enabling detection of diffuse myocardial disease processes that have previously only been detectable with cardiac biopsy (3,4). T1 measurement before and after the administration of gadolinium based contrast agent (GBCA) allows the relative volumes of the intra-cellular and extra-cellular components of myocardium to be quantified, as long as equilibrium between the compartments has been reached.
With increasing use in clinical practice and medical research, it is important that accurate, precise and reproducible methods for T1 mapping are employed (5). Values obtained are dependent upon numerous scanner and pulse sequence parameters including flip angle, acquisition pulse sequence and the interval between inversions. The potential advantages of various modified look-locker inversion recovery (MOLLI) have been investigated by simulation and in phantom studies (6,7), however, direct comparison in vivo has not been made between proposed sequences.
Patient factors, including heart rate (HR) and breath-hold duration, will affect the acquisition both with reference to tissue recovery and image quality. In this study we aimed to determine the reproducibility and accuracy of three published MOLLI acquisition schemes (5) utilising two different flip angles in phantom gels and healthy volunteers.
Methods
All studies were performed at a single centre equipped with a 3.0T Philips Achieva TX research magnetic resonance imaging (MRI) scanner using a 32-channel cardiac phased array receiver coil. Volunteer scanning was approved by the local ethics committee and all subjects gave written informed consent.
MOLLI schemes
ECG triggered MOLLI acquisitions with different number of images were acquired according to three predefined schemes. Pause duration was defined in seconds (s), acquisition duration by beats (b). Scan parameters were: field of view (FOV) (typically 320×400 mm2, but modified to minimise artefact as needed), voxel size 1.98×1.98×10 mm3 (reconstructed to 1.25×1.25 mm2), single-shot, sensitivity encoding (SENSE) factor 2, partial echo factor 0.85, water fat shift 0.4, trigger delay set for end-diastole, turbo field echo (TFE) prepulse delay 350 ms. Acquisition duration was 170-185 ms dependent upon FOV. TI values for the images acquired directly after inversion are spaced equally from the shortest possible value (FOV dependent) for the first inversion to 350 ms for the final inversion to representatively sample magnetisation recovery. Images are then acquired at the same cardiac phase in the subsequent images.
All three schemes were acquired with flip angles of 50° and 35°. A flip angle of 50° was chosen as a value frequently used in the existing literature (8). The value of 35° was chosen to maximise signal from native myocardium at 3T according to the formula:

If myocardial native T1 is assumed to be ≈1,200 ms, a flip of angle of approximately 35° results in maximal signal.
Phantom scanning
A total of 12 agarose gel phantoms with known T2 time were studied. T2 values were obtained using a multiple-spin-echo sequence with repetition time (TR) =5,000 ms and echo time (TE) ranging from 30-240 ms in 30 ms increments. A mono-exponential function was fitted on a voxel-by-voxel basis to estimate T2, and mean values calculated for each gel. Reference T1 relaxation times of each phantom were determined using standard inversion recovery spin echo pulse sequences (IRSE) using varying inversion times: 50, 100, 150, 200, 300, 500, 750, 1,000, 1,250, 1,500, 2,500, 4,000 ms. TR 10 ms, TE 12 ms, slice thickness 10 mm and acquired resolution 1.5×1.5 mm2. Having determined reference T1, gels were studied using MOLLI schemes at a range of HRs. A physiology simulator set to HRs of 40, 60, 80, 100 b/min was used to trigger the MOLLI scans.
Volunteer scanning
Ten healthy volunteers were recruited to undergo magnetic resonance (MR) studies. Subjects were excluded if they had a history of cardiac disease, hypertension, renal impairment, diabetes or contra-indication to MR. Volunteers underwent two studies, separated by a mean interval of 17.1±14.2 days.
The cardiac long-axis was located as per standard practice and a stack of left-ventricular (LV) short axis images acquired using an ECG gated balanced steady state free procession (bSSFP) method (TE 1.3 ms; TR 2.6 ms; flip angle 40°, spatial resolution 1.6×2.0×10 mm3, 40 phases per cardiac cycle).
GBCA was administered as two split doses as part of a stress perfusion MR study. Adenosine was administered at 140 mcg/kg/min−1 via a cannula sited in the ante-cubital fossa for a minimum of 3 min and until maximal vasodilation occurred, 0.075 mmol/kg Gadovist (Bayer Schering Pharma, Berlin-Wedding, Germany) boluses were separated by 12 min, followed on each occasion by a 20 mL saline flush. Post contrast MOLLIs were performed 15 min after the second bolus of gadolinium.
LGE imaging was performed at 7-10 min following final contrast dose (inversion recovery-prepared T1 weighted gradient echo, inversion time according to Look-Locker scout, TR/TE/flip angle 3.7 ms/2.0 ms/25°, acquired spatial resolution 1.54×1.75×10 mm3) as a contiguous stack with no gap, with complete coverage of the left and right ventricles.
Image analysis
LV volumes and ejection fraction (EF) were analysed from bSSFP cine images using standard analysis methods. Phantom and volunteer MOLLI study images were saved as digital imaging and communications in medicine (DICOM) format. T1 values were calculated from source images using manual motion correction on CMR42 (Circle Cardiovascular Imaging Inc., Calgary, Alberta, Canada). In phantoms a region of interest (ROI) was drawn in the centre of the gel away from any ringing artefact.
In volunteer MOLLI data sets, a narrow ROI in the infero-septum of the mid-ventricular slice was drawn as per Rogers et al. (9) to replicate application of T1 mapping in clinical practice. Furthermore, segmental analysis was performed using a narrow ROI in each segment of the mid LV slice in accordance with the American Heart Association (AHA) model (10). Conservative ROIs were drawn in each segment taking care to avoid artefact induced by epicardial vessels. Mis-registration was avoided by visually comparing left and right ventricular anatomical features (e.g., papillary muscles, trabeculations), and any mis-registered images were discarded. The blood pool contour was drawn in the centre of the LV cavity on the same slice away from any papillary muscle.
Extracellular volume (ECV) fraction was calculated using the formula.
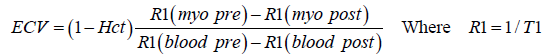
Any scans where artefact prohibited analysis were discarded.
Statistical analysis
Statistical analysis was performed using IBM SPSS Statistics 20.0 (IBM Corp., Armonk, NY, USA). Continuous variables are expressed as means ± standard deviation (SD). Reproducibility and agreement were assessed by coefficient of variation (CoV), both comparing IRSE T1 reference values to MOLLI T1 value in phantoms, and also to assess the inter-study variability of repeat MOLLI studies in volunteers. CoV of less than 10% was considered acceptable.
Results
Phantom scan
Reference T1 values were: 228, 346, 539, 564, 784, 895, 927, 1,302, 1,537, 1,674, 1,854 and 1,949 ms. Co-efficient of variability with each MOLLI scheme at simulated HR of 40, 60, 80, 100 with flip angle of 35° was 6.77 to 9.55; when flip angle was 50 CoV ranged between 7.76 and 11.1 (Table 1).

Full table
T1 was persistently under-estimated by all MOLLI acquisitions. Error was greatest when gel T1 was longer, and at higher HRs.
For all schemes at a simulated HR of less than 100 b/min the co-efficient of variability was acceptable at less than 10%. Performance of the 3b(3s)3b(3s)5b MOLLI with 50° showed the lowest precision (CoV: 11.10). The performance of the MOLLI schemes in phantoms compared to reference T1, when T1 is of clinical relevance, (346, 539, 927, 1,302, 1,949 ms with T2 respectively 113, 86, 99, 180, 161 ms) are shown in Figures 1 and 2.


Subject scanning
Demographic characteristics of the study population are as presented in Table 2. The mean age was 27±3 years (seven males). Body surface area (BSA) corrected left ventricular end diastolic volume (LVEDV) (101±12 mL/m2), LV mass (52±7 g/m2) and EF (57%±2%) were normal. All volunteers had normal right ventricular function and had normal LGE images; 119 of 120 acquired mid-ventricular short axis MOLLI acquisitions were suitable for analysis (one acquisition error prohibited analysis).

Full table
Native myocardial T1: With a flip angle of 35° infero-septal native T1 (ms) was similar for all MOLLI acquisitions (Table 3). Native T1 was higher when flip angle was 35° compared to 50°, and highest using the 5b(3s)3b scheme. Inter-study reproducibility of native T1 measurement was good for all pulse sequences (Table 4).

Full table

Full table
Post contrast T1: Using a flip angle of 35°, infero-septal post-contrast T1 (ms) was similar for all MOLLI acquisitions and coefficient of variability was low (Table 5).

Full table
Extra cellular volume: ECV (%) was reproducible with each scheme employed and agreed well on visit one and two. The co-efficient of variability for all three schemes and for both flip angles was less than 7% (Table 3).
Segmental analysis: It was possible to measure native and post contrast T1 in all mid-LV segments, and measurement was not precluded by artefact. ECV in all six segments of the mid-LV slice was similar (calculated from pre- and post-contrast T1 maps), SDs were low and did not differ between segments or sequence (Table 6).

Full table
Discussion
Previous studies have examined multiple sequence parameter variables in simulator, phantoms and volunteer subjects (11). This study aimed to add to these previous studies and further define the effect of change in acquisition scheme and flip angle.
The initially proposed 3b(3s)3s(3b)5 MOLLI scheme is still commonly used (8). However, this may not be ideal for accurate T1 measurement as the final eight chronologically acquired images are influenced by previous inversion(s), so that T1 estimation is affected by incomplete tissue recovery between inversions. To shorten breath-hold time, and reduce the number of points affected by prior inversions, alternative MOLLI schemes have been suggested. These include a 3,5 acquisition, which has been found to perform similarly to 3,3,5 (12,13). However, the same problems relating to potential incomplete recovery are inherent in this scheme also. In this study we found that a 5b(3s)3b scheme with flip angle of 35° agreed best with a gel T1 spin echo reference, which may be a consequence of fewer points being affected by prior magnetisations.
Many commonly used MOLLI acquisitions time pause duration and acquisition intervals in beats, and a pause of three R-R intervals (3b) is commonly used. This leads to inconsistent pause duration, and potentially subsequent underestimation of long T1, as recovery may not be complete. This is particularly true of the 3b(3b)3b(3b)5b scheme at higher HRs (14). A fixed pause duration of at least 3 s, as employed in this study, may minimise this problem and ensure more complete recovery of native blood pool and myocardium where T1 at 3T is typically 1,800 ms and 1,200 ms. However, in this study we have demonstrated that under-estimation of native T1 remains problematic in phantom studies at high HRs in spite of fixed pause duration. This is likely due to incomplete recovery: for example using a 5b(3s)3b the time between inversions is 9,000 ms whereas at 100 b/min it is only 6,000 ms.
Due to the effects of incomplete recovery it has been suggested to employ different MOLLI schemes for native and post contrast T1 measurement. The pause duration employed in this study was approximately 5.5 times the T1 of post contrast myocardium, which has previously been shown to have only a negligible effect on post contrast myocardial T1 measurement at HRs up to 90 (15).
When T1 is short, for instance after GBCA administration, incomplete recovery of longitudinal magnetisation between inversion pulses is minimal and additional points sampled early following inversion pulse may improve accuracy and precision. A 4,3,2 acquisition scheme with either a single RR (5) or 3b interval recovery (16) period has been suggested as an alternative to both 3,3,5 and 5,3 in this situation. However, in this study we employed a 3 s pause, rather than the 1 s pause (5), throughout to aid comparison between schemes.
Similarly, if the signal-to-noise ratio (SNR) of myocardium is not maximised, image quality may be suboptimal, which will reduce fitting quality in the T1 estimation and precision (5). Signal is dependent on the readout pulse flip angle and is maximal for a balanced steady-state free precession sequence (as used for MOLLI) when (17):
Therefore a flip angle may be selected to maximise signal from any image component depending upon a tissue’s T1 value. The effects of flip angle on signal have been studied previously (11). A flip angle of 50° leads to high signal within the blood pool and an impression of good image quality due to high myocardium-blood contrast, whilst a flip angle of ~35° results in maximal SNR for native T1 measurement within healthy myocardium (assuming T1 =1,200 ms and T2 =40 ms) at the expense of a visually less appealing T1 map due to the blood pool appearing less homogenous. Following contrast administration, T1 shortens and higher flip angles result in higher SNR, however, signal already increased following GBCA administration, therefore maximising signal from pre-contrast myocardial T1 becomes most relevant. In this study, native in vivo T1 was similar with MOLLI sequences using either 35° or 50° flip angle; however, T1 was highest when using a flip angle of 35° and therefore more likely to be a true representation of tissue T1, as MOLLI tends to underestimate T1.
The shorter breath hold time that the 5b(3s)3b sequence employs means it may be better tolerated in patients with breathlessness and/or LV dysfunction when compared to 3b(3s)3b(3s)5b and 4b(3s)3b(3s)2b—though this was not investigated in this study. Comparative breath hold times using 5b(3s)3b, 3b(3s)3b(3s)5b and 4b(3s)3b(3s)2b at a HR of 60 b/min are 11, 17 and 15 s respectively. This may have positive implications for image quality by minimising cardiac motion due to respiration when T1 mapping is used as a clinical or research tool.
All schemes performed similarly regardless of the LV segment where T1 was measured. Previous studies have shown that infero-septal T1 is the most reproducible segment for T1 measurement (9). However, we did not undertake to measure SNR in this study. Lower SNR, especially in the lateral wall as previously demonstrated (5) will result in less precision of T1 and until this is quantified some caution should be applied to the widespread application of T1 segmental T1 mapping.
We found the studied MOLLI sequences to be similarly reproducible, with good agreement between visits. The 2013 Society for Cardiovascular Magnetic Resonance (SCMR) T1 mapping consensus document (18) acknowledges that there is variation in MOLLI sequences used globally, and whilst optimal pulse sequences are being defined it is important to establish local normal values. These data suggest that these three MOLLI sequences, with two different flip angles, perform similarly; potentially suggesting that robust local practice and patient factors should be considered when deciding upon the ideal T1 mapping scheme, including scan duration and breath-hold duration.
Conclusions
Further, larger datasets may allow more comprehensive conclusions to be drawn regarding ideal MOLLI acquisition. However, in this study we have shown that 5b(3s)3b performs similarly to 3b(3s)3b(3s)5b whilst offering advantages in breath hold duration and likely improvement in respiratory motion, suggesting it may be more appropriate for clinical application. This small study did not include patients to assess the effects of change in MOLLI scheme in areas with elevated ECV. SNR was not quantified in this study.
Acknowledgements
Funding: AK McDiarmid is funded by British Heart Foundation Project Grant (PG/14/10/30641). DA Broadbent has a Doctoral Research Fellowship from the National Institute for Health Research (DRF-2012-05-155). S Plein is funded by a British Heart Foundation Senior Fellowship (FS/10/62/28409) and has received a research grant from Philips Healthcare.
Footnote
Conflicts of Interest: The authors have no conflicts of interest to declare.
References
- Silva C, Moon JC, Elkington AG, John AS, Mohiaddin RH, Pennell DJ. Myocardial late gadolinium enhancement in specific cardiomyopathies by cardiovascular magnetic resonance: a preliminary experience. J Cardiovasc Med (Hagerstown) 2007;8:1076-9. [PubMed]
- Lockie T, Nagel E, Redwood S, Plein S. Use of cardiovascular magnetic resonance imaging in acute coronary syndromes. Circulation 2009;119:1671-81. [PubMed]
- Ugander M, Oki AJ, Hsu LY, Kellman P, Greiser A, Aletras AH, Sibley CT, Chen MY, Bandettini WP, Arai AE. Extracellular volume imaging by magnetic resonance imaging provides insights into overt and sub-clinical myocardial pathology. Eur Heart J 2012;33:1268-78. [PubMed]
- Sado DM, Flett AS, Banypersad SM, White SK, Maestrini V, Quarta G, Lachmann RH, Murphy E, Mehta A, Hughes DA, McKenna WJ, Taylor AM, Hausenloy DJ, Hawkins PN, Elliott PM, Moon JC. Cardiovascular magnetic resonance measurement of myocardial extracellular volume in health and disease. Heart 2012;98:1436-41. [PubMed]
- Kellman P, Arai AE, Xue H. T1 and extracellular volume mapping in the heart: estimation of error maps and the influence of noise on precision. J Cardiovasc Magn Reson 2013;15:56. [PubMed]
- Kellman P, Hansen MS. T1-mapping in the heart: accuracy and precision. J Cardiovasc Magn Reson 2014;16:2. [PubMed]
- Kellman P, Xue H, Chow K, Spottiswoode BS, Arai AE, Thompson RB. Optimized saturation recovery protocols for T1-mapping in the heart: influence of sampling strategies on precision. J Cardiovasc Magn Reson 2014;16:55. [PubMed]
- Messroghli DR, Radjenovic A, Kozerke S, Higgins DM, Sivananthan MU, Ridgway JP. Modified Look-Locker inversion recovery (MOLLI) for high-resolution T1 mapping of the heart. Magn Reson Med 2004;52:141-6. [PubMed]
- Rogers T, Dabir D, Mahmoud I, Voigt T, Schaeffter T, Nagel E, Puntmann VO. Standardization of T1 measurements with MOLLI in differentiation between health and disease--the ConSept study. J Cardiovasc Magn Reson 2013;15:78. [PubMed]
- Cerqueira MD, Weissman NJ, Dilsizian V, Jacobs AK, Kaul S, Laskey WK, Pennell DJ, Rumberger JA, Ryan T, Verani MS. American Heart Association Writing Group on Myocardial Segmentation and Registration for Cardiac Imaging. Standardized myocardial segmentation and nomenclature for tomographic imaging of the heart. A statement for healthcare professionals from the Cardiac Imaging Committee of the Council on Clinical Cardiology of the American Heart Association. Int J Cardiovasc Imaging 2002;18:539-42. [PubMed]
- Gai ND, Stehning C, Nacif M, Bluemke DA. Modified Look-Locker T1 evaluation using Bloch simulations: human and phantom validation. Magn Reson Med 2013;69:329-36. [PubMed]
- Janardhanan R, Jiji RS, Brooks J, Epstein FH, Kramer CM, Salerno M. A comparison of methods for determining the partition coefficient of gadolinium in the myocardium using T1 mapping. J Cardiovasc Magn Reson 2011;13:O81.
- Puntmann VO, Voigt T, Dabir D, Rogers T, Schaeffter T, Nagel E. Are T1 values to characterize myocardial tissue equivalent between various sequences: comparison of MOLLI, shMOLLI, 3'5-MOLLI and SASHA. J Cardiovasc Magn Reson 2013;15:E18.
- Messroghli DR, Walters K, Plein S, Sparrow P, Friedrich MG, Ridgway JP, Sivananthan MU. Myocardial T1 mapping: application to patients with acute and chronic myocardial infarction. Magn Reson Med 2007;58:34-40. [PubMed]
- Zhang SJ, Wang YX, Yuan J, Jin J, Wang YC, Chang D, Weng D, Greiser A, Ju S. Time-efficient myocardial contrast partition coefficient measurement from early enhancement with magnetic resonance imaging. PLoS One 2014;9:e93124. [PubMed]
- Schelbert EB, Testa SM, Meier CG, Ceyrolles WJ, Levenson JE, Blair AJ, Kellman P, Jones BL, Ludwig DR, Schwartzman D, Shroff SG, Wong TC. Myocardial extravascular extracellular volume fraction measurement by gadolinium cardiovascular magnetic resonance in humans: slow infusion versus bolus. J Cardiovasc Magn Reson 2011;13:16. [PubMed]
- Bernstein MA, King KF, Zhou XJ. Handbook of MRI pulse sequences. London: Elsevier Academic Press, 2004.
- Moon JC, Messroghli DR, Kellman P, Piechnik SK, Robson MD, Ugander M, Gatehouse PD, Arai AE, Friedrich MG, Neubauer S, Schulz-Menger J, Schelbert EB. Society for Cardiovascular Magnetic Resonance Imaging. Cardiovascular Magnetic Resonance Working Group of the European Society of Cardiology. Myocardial T1 mapping and extracellular volume quantification: a Society for Cardiovascular Magnetic Resonance (SCMR) and CMR Working Group of the European Society of Cardiology consensus statement. J Cardiovasc Magn Reson 2013;15:92. [PubMed]

